


What do the Olympic Games have to do with FOAK plants and the Learning Curve?

Earlier this summer, I finished reading How Big Things Get Done, a fascinating book by Bent Flyvbjerg and Dan Gardner. The authors explore mega projects—from movies to complex industrial facilities—and what it takes to make them happen. Through various case studies, the book highlights how large projects often go over budget and schedule, with a simple recipe to avoid that: “plan slow and act fast.” However, in practice, project managers frequently shorten the planning phase in hopes of speeding up execution, a methodology that almost always leads to regret.
One of the featured case studies in the book is the Olympic Games, which is particularly timely as we closely followed Paris 2024 this summer. The Olympic Games are massive projects that cost host nations billions of dollars to build stadiums, venues, transport infrastructure, accommodation, and more. The preparation spans seven years, followed by 16 days of competition and about one year of dissolution. With its extended preparation timeline, the Olympic Games resemble First-of-a-Kind (FOAK) plants, a concept gaining traction in the climate-tech world.
A FOAK plant is defined as a facility or project that implements a new technology or process at a commercial scale for the first time. These projects represent a crucial step toward commercializing low-carbon climate technologies at scale to tackle climate change. Unlike demonstration projects or pilot plants, FOAK plants are full-scale operations designed to prove that an innovative concept can be both technically and economically viable in real-world conditions. FOAK projects often involve novel designs, materials, or processes that have not yet been validated on a large scale. Similarly, each Olympic Games is a unique event with bespoke infrastructure, facilities, and logistics tailored to the host city, often accompanied by unforeseen challenges.
FOAK projects and the Olympic Games both lack established standards and face high levels of complexity due to their uniqueness. Every Olympic Games requires a complex blend of international standards and custom arrangements, influenced by geography, climate, existing infrastructure, and cultural differences, making standardization difficult. This mirrors the challenges faced by FOAK projects, which also grapple with custom designs and the lack of a blueprint to follow.
According to a recent study published by Oxford University (also co-authored by Bent Flybjerg)1, the last three Summer Olympic Games (prior to Paris 2024) cost a total of $51 billion and exceeded their budgets by 185%. This figure only includes the cost of the Games and excludes additional expenses such as transport and accommodation infrastructure, which are much larger in scale. The average cost overrun for Olympic Games between 1960 and 2024 is around 160%. The chart below shows the development of cost overruns over this period. While there was a decline in cost overruns until 2008, they have increased again since then.

Olympic Games rank just behind nuclear storage in average cost overrun among mega projects, highlighting the financial challenges of managing large, complex initiatives.

So, why do the costs for the Olympic Games keep increasing? What causes such significant cost overruns? And what drives successful cost reduction stories in other technologies, like solar?
Lazard, a global financial services firm, published the latest version of their annual levelised cost of energy (LCOE) report earlier this year2. For those unfamiliar with it, LCOE analysis shows the unit cost of electricity generation—including all capital, operations, and maintenance costs—on a $/MWh basis for various technologies, including both fossil fuels and renewables. The Lazard report also includes the historical evolution of LCOE, providing valuable insights into the significant cost declines in renewable energy generation technologies.
As highlighted in another The Curious Learners article, LCOE for utility-scale solar generation has undergone a significant cost reduction, dropping from $359/MWh in 2009 to $60/MWh in 2023. However, there has been an unfortunate reversal of the trend in recent years, largely due to global supply chain disruptions driven by major events such as the COVID-19 pandemic and the Ukraine-Russia war. This reversal underscores the need to build localized supply chains for the energy transition, though that topic warrants a separate discussion.
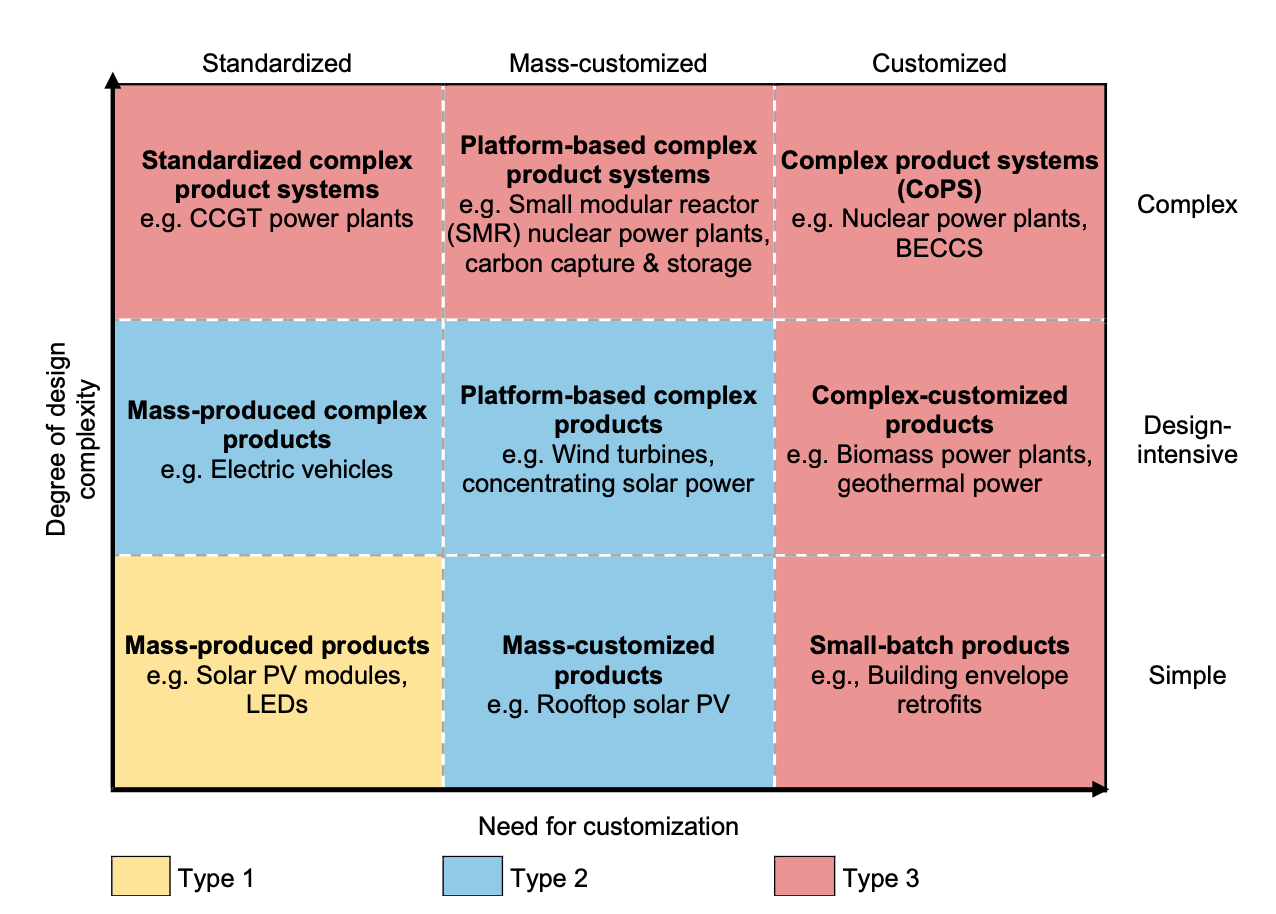
The learning curve for any technology is primarily influenced by design, manufacturing principles, and market dynamics. According to a study by EY focused on nuclear power, five critical factors are expected to maximize the learning curve: modularization and factory build, high production rates, design standardization, a consistent supply chain, and a stable regulatory environment3. An academic study that reviewed learning curves for different technologies reached similar conclusions, identifying two major elements that drive the pace of the learning curve: design complexity and the need for customization4.
The chart below is helpful in positioning various technologies across two axes: design complexity and the need for customization. As expected, Solar PV sits at the bottom left with the simplest design and the lowest need for customization. Using this grid, the paper also groups technologies into three types with varying needs for national and global policy development:
Type 1 technologies have access to large and growing global markets that induce further innovation.
Type 2 technologies offer opportunities for national green industrial policies that foster local industry, technological adaptation, and participation in global value chains.
Type 3 technologies require a mix of national green industrial policies and international coordination to promote inter-project and inter-context learning on a regional or global scale.
Another critical factor that contributes to the learning curve is knowledge sharing, especially for Type 2 and Type 3 technologies, where global-scale coordination is essential. Returning to the Olympic Games example, the International Olympic Committee (IOC) initiated a knowledge transfer program in the mid-90s in preparation for the Sydney 2000 Olympic Games. Officially launched in 2003 as the Olympic Games Knowledge Management Program (OGKM), it was designed to enhance the transfer of knowledge to host nations, evolving into its current form as Information, Knowledge, and Games Learning5. Over the seven-year preparations, the accumulated knowledge base proved extremely valuable for host nations.
Similarly, the climate-tech community must prioritize collective knowledge and information sharing to effectively address climate change. This approach can significantly contribute to the cost reduction, scaling, and deployment of FOAK technologies. By sharing best practices, lessons learned, and technical data, organizations can avoid repeating mistakes, thereby accelerating the maturation of these technologies along their learning curves. For example, knowledge sharing can directly contribute to cost reduction by disseminating information on efficient design, optimized operational procedures, and innovative financing models. This transparency enables companies to leverage previous experiences, which reduces the need for costly trial-and-error approaches.